Review of Tenmars TM-195
In this article we review the radiofrequency electromagnetic meter Tenmars TM-195.
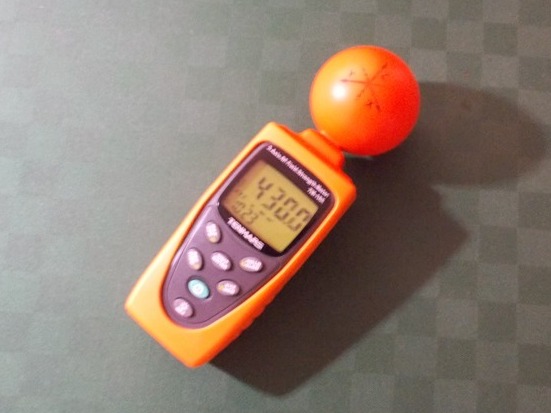
Display
The display does not have a good reading angle. It is only easy to read it from the direction perpendicular to the display. If it is viewed from an angle it is impossible to read. This makes it difficult to read the values when the instrument is placed on a table in a vertical position. The display is also a passive LCD so the bright light from the front renders it unreadable.
Changing units
The measurement unit changes by itself during a measurement. For example if the instrument is showing a value in uW/m2 and the value goes beyond 1999 units, the instruments switches to the mW/m2 unit and so suddenly the value displayed becomes 1000 times lower, for example 2.0. This is annoying and creates problems, one can even think that the value has dropped so much for a while, but instead it has gone up.
Unit label
The label of the current unit is too small and cannot be easily read from a distance. If the measurement unit were not able to change alone this wouldn't be a problem, but the instrument changes unit by itself.
Moving decimal point
The display also moves the decimal point by itself, which means that it changes the number of digits after the decimal point. For example, if the display is showing a value between 20 uW/m2 and 90 uW/m2 the decimal point is located in the middle and there are two digits after the decimal point, but if the value goes below 20 and becomes for example 19 then the instrument moves the decimal point to the left and shows three digits after the decimal point. This mechanism is made to use the first region of the display which can show only the digit 1, but it creates problems. It would be better if the decimal point didn't move during the measurement.
Sensor
It seems that the sensor is inside the plastic ball at the top of the instrument. It would be very confusing if the sensor wasn't entirely in the ball. When the instrument is set to XYZ mode (which is the default mode), in theory it should measure three components of electric field, along three mutually perpendicular axes fixed to the instrument. Given that there is a spherical enclosure around the sensor we suppose that these axis all cross at the center of the ball. So in theory rotating the instrument, but keeping the ball in the same point of space, the measured value shouldn't change much, it could have a small variation but it should remain approximately the same. Instead the value shown by the instrument is very different according to the orientation of the instrument, even when the ball remains in the same point. These are not the variations due to the motion of the instrument. This difference is between the stable values that are obtained after a few seconds with the instrument immobile.
AVG function
The AVG mode should produce an average of the instantaneous values collected by the instrument, but the number of values taken for calculating the average is unknown. It is not written in the small user guide, and neither in other places. It could get two successive values, or three, or ten, it isn't specified. When the AVG mode is activated, the time indicator gets replaced by an indicator of the minutes and seconds that have passed since the activation of the AVG mode. Does it mean that the average is calculated over all the values collected in that time interval, which means from the activation of the AVG until the current time ? It is not explained. In the user manual there is a drawing that shows a curve for the AVG value that varies quite a lot with time. So it seems that the average is calculated over a fixed number of values collected in the previous instants, but this is not explained anywhere, neither in the little manual nor on the Tenmars website.
Sampling rate
The only information we have is that the instrument takes three measures every two seconds, which means that the frequency of the measurement is 1.5 Hz, so the time between two consecutive measures is 0.667 s. This rate is fixed. Instead the instrument should have a variable sampling rate, the user should be able to set a lower or higher rate.
User guide
The user guide is badly translated into English. For example, the instructions to set the date and time of the clock of the instrument say to press a button and another. It seems that the user has to press the first button and then the second. Instead the buttons must be pressed simultaneously, so the instruction should have been written in a different way, for example "press button A and button B together" or "press A and B at the same time". Clearly the translators didn't try the instrument at all.
Operation principle
This instrument measures the electric field only, not the electromagnetic power density. This is also written in the manual. The value of power density is calculated by the instrument starting from the value of electric field measured. The formulas used for this calculation are the standard formulas of the electromagnetic radiation in the far field. These formulas are certainly not reliable for the measures near to the electromagnetic sources. It is well known that the electromagnetic field near a source is very different from that far from the source. Near the source the electromagnetic field can be either "more electric and less magnetic", or vice versa, "more magnetic and less electric". The ratio of the electric field intensity and the magnetic field intensity near the source can be very different from point to point, and for various sources, and it is different from the ratio in the regions far from the source. Far from the source, which means in the far field, the ratio of E and H is equal to the characteristic impedance of the vacuum, Z0 = 377 Ohm. So this instrument is made for measuring the electromagnetic fields in the far region only. Let's remember that the far region depends on the frequency of the radiation and from the size and shape of the source. With a higher frequency the far region becomes closer to the source. With a larger source the far region becomes equally far from the source. All this is valid only if the source is completely far from other objects that reflect or change the electromagnetic field in any way.
Frequency band
This instrument, having a single range of frequencies from 50 MHz to 3.5 GHz, doesn't allow the user to distinguish the emissions of different types in this very wide interval. The value shown by the instrument could be due to EMF in the 50 MHz - 60 MHz band, or in the 160 - 200 MHz band, or in the 600 MHz - 800 MHz, band, or in the 2.5 GHz - 3 GHz band etc.... We can't tell anything more than the compound intensity of all the frequencies between 50 MHz and 3.5 GHz. In practice the transition at the limits of the band is not sharp at all, so even this has to be considered just an indicative value.
Practical tests
The instrument doesn't detect anything from a 7" tablet which has the Wi-Fi
network turned off.
The instrument shows almost nothing of the emissions of a commercial LCD monitor
with LED backlight, and external SMPS.
The instrument hardly shows anything from a ADSL modem router that has no Wi-Fi.
The instrument shows something near a ADSL modem router with the Wi-Fi turned on.
The reading goes up to 2 mW/m2, while it is just 8 uW/m2 when the Wi-Fi of the
router is disabled.
The instrument shows a little EMF from some objects that contain metal parts
even if they aren't electrically active, which means that the EMF is picked up
and reflected by the object but doesn't come from the circuits of the object.
Conclusions
In conclusion this instrument is not useful for detecting most of the electromagnetic fields and radiation sources indoor, in homes or offices. It may be useful to evaluate the electromagnetic pollution outdoor, due to the cellphone towers. Other people have shown that this instrument is also too slow to show the pulses generated by the "smart meters", i.e. the electric power meters that communicate via wireless like big cellphones, see this video.